lundi 31 décembre 2012
jeudi 27 décembre 2012
TLS et MTLS en environnement Lync 2010
Pour sécuriser les flux de signalisation il est de bon ton de les encrypter, En règle général on utilise pour ce faire TLS (transport Layer Security),
Dans une architecture Lync on utilise une seconde méthode basée sur un sous protocol TLS : MTLS ( multiplexed transport layer security).
L'image ci dessous permet de visualiser en fonction des flux échangés dans quel cas on utilise TLS ou MTLS.
Pour en savoir plus :
http://technet.microsoft.com/en-us/library/gg195752%28v=ocs.14%29.aspx
Simulate Equity Curve for your System
A system with 50% success ratio can be a killer with always growing equity curve. Test is by yourself!
Very nice tool for simulating Equity Curve.
Here is more info:
http://tradingarsenal.com/tutorials-courses-webinars-books-info/559-generate-equity-curve-your-system.html
Very nice tool for simulating Equity Curve.
Here is more info:
http://tradingarsenal.com/tutorials-courses-webinars-books-info/559-generate-equity-curve-your-system.html
mercredi 26 décembre 2012
benefits and disadvantages Harmonic Trading
We created a Skype Group to discuss the advantages and disadvantages of Harmonic Trading. Focused on the Practical aspects!
Based on the different discussions and questions that you send, it seems to be very interesting and wanted topic. Different traders see and approach it a bit differently.
If you are willing to share your experience and activly participate in the discussion we have, drop a message to TRADINGARSENAL skype account (that holds this discussion group).
mardi 25 décembre 2012
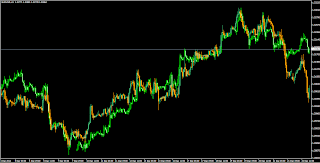
Charts overlay correlation indicator
 |
| charts overlay mt4 indicator |
Great if you benefit from instruments correlation in your trading system.
You can download this indicator (including source code) here -> Charts overlay indicator
mardi 18 décembre 2012
Expert4x forex GRID EA system explained
Pretty nice webinar -> http://expert4x.com/expert4x-no-stop-hedged-grid-forex-trading-ea-support-video/ Covers the pros and cons of the forex grid trading method. It presents (in details) the Expert-4x GRID EA (MT4 platform).
Presented material is rather for grid beginners and skips some important grid trading elements, ...anyway I want still recommend you see it.
Lately at TradingArsenal we verify options to combine grid trading with harmonic patterns trading. Both trading methods have pros and cons and we want to choose the best out of each.
Grid-harmonic trading systems ideas are presented here: TradingArsenal - Trading systems
lundi 17 décembre 2012
Interview with Market Expert - Bruno Estier
The best is to learn from the Experts, right?
Check the Interview with Bruno Estier -> http://www.samt-org.ch/pdf/estier_interview.pdf
Good luck!
Check the Interview with Bruno Estier -> http://www.samt-org.ch/pdf/estier_interview.pdf
Good luck!
samedi 15 décembre 2012
Ichimoku system profitable combined with Harmonic patterns trading
Just to point you to another interesting thread.
Interesting and seems like profitable way to combine Ichimoku system with Forex Harmonic patterns trading.
Comments are welcome.
Link is here: Ichimoku system
121 harmonic pattern traders will surly like the posts starting from #3.
Interesting and seems like profitable way to combine Ichimoku system with Forex Harmonic patterns trading.
Comments are welcome.
Link is here: Ichimoku system
121 harmonic pattern traders will surly like the posts starting from #3.
samedi 8 décembre 2012
Gann SQ9 confirms Harmonic Bat pattern
Our project to verify Gann SQ9 methods as confirmations for Harmonic patterns continues ...
you can read about it here -> Gann trading - market turns timing - price projection
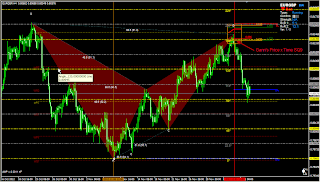
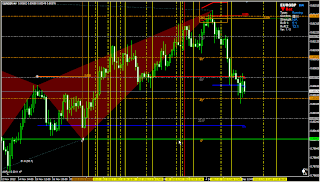
This time we played with calculating Gann SQ9 from harmonic Bat A and C points.
Gann 180degrees price level from A point and Gann 135degrees price level from C point are clustering.
Note the red vertical line calculated from Price x Time square.
More on this on the TradingArsenal Forum where you can find the Gann methods theory we apply here and Gann indicator used in this activities.
you can read about it here -> Gann trading - market turns timing - price projection
This time we played with calculating Gann SQ9 from harmonic Bat A and C points.
Gann 180degrees price level from A point and Gann 135degrees price level from C point are clustering.
 |
| Gann price levels calculated from Bat A point |
 |
| Gann price levels calculated from Bat C point |
Supply Demand confirmation for Harmonic Patterns
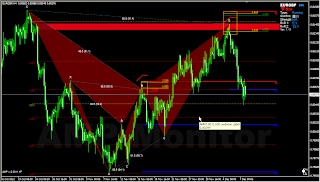 |
| Supply Demand confirmation for harmonic Bat pattern |
Here you will find lots of info regarding Supply and Demand zones, how to create them and how to use them when price reaches the level -> Supply & Demand - by Sam Seiden
Sam Seiden's method is my favourite technique to very precisely define the entry price level/sub-zonesamedi 1 décembre 2012
Libon vous connaissez ?
En vie de joindre gratuitement vos correspondants rien de plus simple utilisez la dernière application totalement Francaise : Libon
Disponible sur Iphone celle ci le sera bientôt sur Android
Pour en savoir plus et connaitre ses évolutions rendez vous le blog :
http://blog.libon.com/fr/
Pour télécharger Libon rendez vous sur iTunes:
https://itunes.apple.com/fr/app/libon-appels-gratuits-repondeur/id402167427?mt=8
Disponible sur Iphone celle ci le sera bientôt sur Android
Pour en savoir plus et connaitre ses évolutions rendez vous le blog :
http://blog.libon.com/fr/
Pour télécharger Libon rendez vous sur iTunes:
https://itunes.apple.com/fr/app/libon-appels-gratuits-repondeur/id402167427?mt=8
mercredi 28 novembre 2012
EURUSD M15 harmonic butterfly bearish with complex zigzag
Pattern internal structure is rather complex and was not recognized by pattern recognition engines, but an experienced eye can see it.
There are actually not so many different fractals in which market trends are ending.
There are actually not so many different fractals in which market trends are ending.
mardi 27 novembre 2012
Trend following MTF Parabolic PSAR indicator
Trend following MTF Parabolic PSAR indicator:
placed twice on EURUSD chart with M15 and H1 settings.
Can it be better and cleaner than Ichimoku indicators? -> Ichimoku methods confirming harmonic patterns trading
placed twice on EURUSD chart with M15 and H1 settings.
Can it be better and cleaner than Ichimoku indicators? -> Ichimoku methods confirming harmonic patterns trading
samedi 24 novembre 2012
Pour en savoir concernant Lync 2013
Pour en savoir plus concernant Lync 2013 je vous invite aujourd'hui à consulter quelques liens :
* La documentation technet :
* Le plus simple étant sans doute de télécharger la documentation :
Ichimoku methods with Harmonic Patterns trading
Watched webinar by Manesh Patel and read couple of articles about the Ichimoku methods. All this to validate practicality of this method, to combine with my harmonic patterns trading.
This resulted in newTHREAD about Ichimoku methods -> Ichimoku methods combined with Harmonic Trading
Links to the webinar and articles I found useful, as well as experience and examples shared by Ichimoku traders are included in the thread.
Time to look for some indicators that may support further Ichimoku vs Harmonic Trading investigations ;-)
happy trading!
jeudi 22 novembre 2012
10 Warren Buffett Quotes You Must Know
10 Warren Buffett Quotes You Must Know
1 .“Rule No. 1: Never lose money. Rule No. 2: Never forget Rule No. 1.”
2 . “You do things when the opportunities come along. I’ve had periods in my life when I’ve had a bundle of ideas come along, and I’ve had long dry spells. If I get an idea next week, I’ll do something. If not, I won’t do a damn thing.”
3.“ Never invest in a business you can’t understand.”
4 “It’s far better to buy a wonderful company at a fair price than a fair company at a wonderful price.”
5. “Only buy something that you’d be perfectly happy to hold if the market shut down for 10 years.”
6. “We simply attempt to be fearful when others are greedy and to be greedy only when others are fearful.”
7. “It’s better to hang out with people better than you. Pick out associates whose behavior is better than yours and you’ll drift in that direction.”
8. “Our favorite holding period is forever.”
9. “Only when you combine sound intellect with emotional discipline do you get rational behavior.”
10. “Without passion, you don’t have energy. Without energy, you have nothing.”
Fibonacci and ABCD pattern webinar
FXStreet Webinar on Fibonacci and ABCD pattern --> Fibonacci Friday Webinar Link
Summary:
Fibonacci need not be difficult! Andrei Knight will share his ABCD pattern which can easily be used to trade news spikes, long-term positions lasting several months, and just about everything in between - a simple pattern which yielded a powerful 77% win ratio over the past 6 years. When Fibs are properly applied to the major moves we've seen during the week, they reveal clues as to where price is likely headed next, as well as the key support and resistance levels it is likely to encounter along the way. Here's your chance to have your favorite currency pairs and time frames analyzed by a professional trader.
mercredi 21 novembre 2012
Gann Angles and Speed Angles trading
Gann Angles are Speed Angles which give us a bunch of informations about the (relative) speed and acceleration of the prices of a market within a specific trading frame.
To read more on the topic (explained by parisboy) and other guys discussion check -> Gann Angles Speed Angles
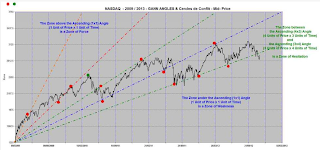 |
| Gann Angles and Speed Angles trading |
To read more on the topic (explained by parisboy) and other guys discussion check -> Gann Angles Speed Angles
mercredi 14 novembre 2012
Introduction to Hedge Grid trading
You may be interested to see our new threads covering the topic of grid trading -> Hedge grid methods explained
An introduction to grid trading, covers the theory and basic concepts of grid trading, presents couple of basic and popular strategies that grid-traders use.
Grid trading in its pure and basic concept does not work very well. Combined with other methods can be very powerful.
Check this post to get to system ideas where harmonic patterns trading is combined with different grid approaches: http://forexharmonictrading.blogspot.com/2012/11/harmonic-grid-trading-system.html
lundi 12 novembre 2012
Forex: GBP/USD declines into European open
FXstreet.com (Barcelona) - Having opened marginally below 1.5900 overnight, spot largely ranged with an upside boas in an attempt to establish itself above the round number before selling off sharply this morning.
Richard Lee, Independent Analyst for FXStreet.com notes that with the penetrations of 1.5959 support, GBP/USD has opened itself up to a bearish bias. He now sees medium term support at 1.5761 and believes that any positive retracement will likely be held at bay by looming resistance at 1.6000. The analysts at Danske Bank are bearish on the pair and recommend selling at 1.5930, with a stop at 1.5965, for a target of 1.5826.
Elsewhere, Asian stocks closed lower whilst European futures are up and commodities are mixed ahead of the European open
samedi 10 novembre 2012
Skype pour Windows8
Skype désormais disponible sur Windows8
J’espère que vous ne m'en voudrez pas d'avoir supprime la vidéo que j'avais posté mais vous conviendrez sans doute comme moi qu'elle était trop sonore
Pour télécharger cette nouvelle version:
http://www.skype.com/intl/fr/get-skype/on-your-computer/windows8/
J’espère que vous ne m'en voudrez pas d'avoir supprime la vidéo que j'avais posté mais vous conviendrez sans doute comme moi qu'elle était trop sonore
Pour télécharger cette nouvelle version:
http://www.skype.com/intl/fr/get-skype/on-your-computer/windows8/
jeudi 8 novembre 2012
Forex Trading Signals for 8th November 2012
SELL on the market: GBP/USD
SELL :
Entry Point : 1.59745
Take Profit: 1.59545
Stop Loss: 1.6045
2nd,,
SELL on GBP/USD :
Entry Point : 1.59905
Stop Loss: 1.60205
-->
We will SELL on the market: EUR/USD
SELL :
Entry Point : 1.27555
Stop Loss: 1.28855
2nd SELL on the market,,,
SELL :
Entry Point : 1.27895
Stop Loss: 1.28195
Wish you all a successful forex trading. Always remember to use your stop loss to avoid much loss on your trading account,,,
mardi 6 novembre 2012
Harmonic Grid trading system - Directional Profits
Posted yesterday ... another grid trading system (combined with harmonic patterns trading) presented by Ziemo:
Harmonic trading system - Directional profits
In the case you missed the previous systems here are the direct links:
Check the people's comments with their trading ideas and improvements suggestions.
lundi 5 novembre 2012
Forex Trading Signals for 6th November 2012
BUY on the market: GBP/USD
BUY :
Entry Point : 1.59877
Take Profit: 1.60077
Stop Loss: 1.59577
2nd,,
SELL on GBP/USD :
Entry Point : 1.59889
Stop Loss: 1.60200
-->
We will SELL on the market: EUR/USD
SELL :
Entry Point : 1.27889
Stop Loss: 1.28200
2nd SELL on the market,,,
SELL :
Entry Point : 1.27965
Stop Loss: 1.28300
Wish you all a successful forex trading. Always remember to use your stop loss to avoid much loss on your trading account,,,
dimanche 4 novembre 2012
Forex Trading Signals for 5th November 2012
BUY on the market: GBP/USD
BUY :
Entry Point : 1.60294
Take Profit: 1.60500
Stop Loss: 1.60000
2nd,,
SELL on GBP/USD :
Entry Point : 1.60505
Stop Loss: 1.60800
--> -->
We will BUY on the market: EUR/USD
--> BUY :
Entry Point : 1.28304
Stop Loss: 1.28000
2nd SELL on the market,,,
SELL :
Entry Point : 1.28649
Stop Loss: 1.29000
Wish you all a successful forex trading. Always remember to use your stop loss to avoid much loss on your trading account,,,
EUR/USD Pair, a fall coming?
Near term EUR/USD outlook: last Friday the market was lower after breaking below the Bullish trend-line base of the possible triangle that had been forming since September, currently at 1.2960/75, now the Resistance.
This is seen as a Bearish sign and raises the potential for further Southside acceleration ahead
Note: from an Elliott Wave analyst’s perspective, the market may be within wave iii, from the 17 October high at 1.3135, of a larger wave 3, from the September high at 1.3165, see the numbering on daily chart below and adds to the potential for a further, downside acceleration ahead, the so called “3rd of 3rd” waves are often the most “explosive” part of a cycle). Nearby support is seen in the 1.2805/30, 200-Day MA and 1 October low, and the base of the Bearish channel since the September high at 1.2750/65.
Gain Access to the Latest Charting and News Technology, Runs on Your Desktop and your iPad , a Must for all Serious traders, info@livetradingnews.com
--> Strategy/position: Short from the 23rd of October sell at 1.2975, with potential for a further downside acceleration ahead and increased likelihood that a more major Top is in place, so would stay with that position. Used a close above the Bearish trend-line from the mid October high as a Stop and though it traded above temporarily early last week, it did nto closed above that mark, for now will continue to Stop above that trend-line, and making a small adjustment for the temp break above, currently at 1.2990/00.
Longer term outlook: looking for a multi-month period of ranging higher from the July low, before resuming the longer term decline. Expected a final, short-lived push above the September high at 1.3165 before completing a more important top, but given the nearer term bearish outlook, looks more like that Top is in place. This targets a eventual decline to the July low at 1.2045 and lower, the seasonal chart points sharply higher into the end of the year and raises some risk for another few months of choppy/volatility as part of a broader topping.
Strategy/position: with the likelihood increased that a more important top is in place, and correction since July is finally “complete”, would switch the longer term Neutral bias, from 31 July at 1.2300 back to the Bearish side here, currently at 1.2845.
Current: short 16 October at 1.2975, stop on close above Bear t-line from mid October now at 1.2990/00.
Last : short Oct 9th at 1.2870, stopped Oct 16th on close above 1.3020 (closed at 1.3050).
Last : short Oct 9th at 1.2870, stopped Oct 16th on close above 1.3020 (closed at 1.3050).
Longer term: Bearish bias 2 November at 1.2845, some risk for another month or 2 of a broader topping.
Last : Neutral 31 July at 1.2300 from Bearish 15 February at 1.3085, warned of few months of correcting.
Last : Neutral 31 July at 1.2300 from Bearish 15 February at 1.3085, warned of few months of correcting.
Hong Kong is the World’s Finance Center
Hong Kong has been chosen the world’s number one financial center for the second straight years, by the World Economic Forum.
The city shows strength in its business environment, infrastructure and favorable tax scheme, the organization said in a report.
“This year, Hong Kong not only maintains its position, but also manages to increase its relative score, thereby creating a wider gap between it and United States,” the WEF said in a report.
The United States, Britain, Singapore, Australia and Canada followed Hong Kong on the list this year. The top six remained unchanged from 2011, owing to slow global recovery and capital flows, the WEF said.
Japan, Switzerland, the Netherlands and Sweden also made to the top ten this year.
Mainland Chinese shares lifted Hong Kong markets with their best daily performance in nearly a month on Thursday, boosted by stronger Chinese economic data and a report that more city governments were easing restrictions on the real estate sector.
The state-run China Securities Journal reported on Thursday that as many as six Chinese cities have made it easier to obtain funds for home purchases which will, in turn, bolster land sales, a major revenue source for local governments.
The Hang Seng Index went into the midday trading break 0.6 percent higher at 21,772.6, just shy of the year’s intra-day highs of 21,847.7. The China Enterprises Index of the top Chinese listings in Hong Kong rose 0.8 percent.
The CSI300 Index of the top Shanghai and Shenzhen listings jumped 2.1 percent, while the Shanghai Composite Index climbed 1.8 percent. Both indices are set for their respective best daily performance since October 9, outshining Asian peers on the day.
In Hong Kong, traders said some investors were rotating out of Hong Kong developers and into Chinese developers, with the worst seemingly over for the latter and some major Chinese developers reported positive third-quarter earnings.
On the other hand, some investors expect more policy curbs in Hong Kong could be in store because of greater capital inflows.
--> China Overseas Land & Investment reversed early losses to go into the midday break up 1.2 percent. China Resources Land was up 1.4 percent.
Hong Kong developers Cheung Kong Holdings was up 0.5 percent, while Henderson Land edged up 0.6 percent — both recovering from steep losses earlier this week after Hong Kong announced late last Friday demand-side home purchase curbs on the sector aimed at reducing foreign demand.
Forex - GBP/USD weekly outlook: November 4 - 9
 Forexpros - The pound was lower against the broadly stronger U.S. dollar on Friday, after stronger-than-expected U.S. jobs data boosted demand for the greenback, while uncertainty over the upcoming U.S. presidential elections also weighed.
GBP/USD hit 1.6174 on Thursday, the pair’s highest since October 17; the pair subsequently consolidated at 1.6020 by close of trade on Friday, down 0.46% for the week.
Cable was likely to find support at 1.5935, the low of October 24 and resistance at 1.6132, Friday’s high.
The U.S. Department of Labor said the economy added 171,000 jobs in October, beating forecasts for an increase of 125,000. The unemployment rate ticked up to 7.9% from 7.8% in September as more people re-entered the labor force.
The stronger-than-expected data saw investor’s trim back expectations for another round of quantitative easing by the Federal Reserve, bolstering demand for the greenback.
Demand for the greenback continued to be underpinned by uncertainty over the outcome of Tuesday’s U.S. presidential elections, with opinion polls indicating a dead heat between President Barack Obama and Republican challenger Mitt Romney.
Investors are concerned over the U.S. fiscal cliff, approximately USD600 billion in tax hikes and spending cuts due to come into effect on January 1, which could threaten U.S. and global growth.
Market sentiment was also hit by ongoing uncertainty over when Spain may request a bailout and whether Greece can implement austerity measures in order to secure the next tranche of its bailout funding.
The pound was higher against the greenback earlier in the session after data showed that the U.K.’s construction purchasing managers’ index for October rose to 50.9 from 49.5 the previous month, beating expectations for a decline to 49.1.
The data added to hopes for a sustained economic recovery after official data in late October showed that the U.K. economy emerged from a recession in the third quarter.
On Thursday, a report showed that the U.K. manufacturing PMI fell to 47.5 in October from a reading of 48.4 in September, compared to expectations for a dip to 48.1.
In the coming week, investors will be anticipating the outcome of Tuesday’s U.S. presidential elections and looking ahead to policy meetings by the Bank of England and the European Central Bank on Thursday.
In addition, market participants will be awaiting any further developments in the handling of the debt crisis in the euro zone.
Ahead of the coming week, Forexpros has compiled a list of these and other significant events likely to affect the markets.
Monday, November 4
The U.K. is to release data on service sector activity, a leading indicator of economic health.
In the U.S., the Institute of Supply Management is to publish data on service sector activity.
Tuesday, November 6
--> The U.K. is to release official data on manufacturing and industrial production, leading indicators of economic health.
In the U.S, voting in the U.S. presidential elections is to take place.
Wednesday, November 7
The U.S. is to publish government data on crude oil stockpiles.
Thursday, November 8
The U.K. is to publish official data on the trade balance, while the BoE is to announce its benchmark interest rate.
Also Thursday, the U.S. is to publish official data on the trade balance as well as the weekly government report on initial jobless claims.
Friday, November 9
The U.S. is to round up the week with preliminary data from the University of Michigan on consumer sentiment, a leading indicator of economic health.
Forex - EUR/USD weekly outlook: November 4 - 9
Forexpros - The euro fell to a one-month low against the broadly stronger U.S. dollar on Friday, as demand for the greenback was boosted by better-than-expected U.S. jobs data, while uncertainty over the U.S. presidential elections also weighed on market sentiment.
EUR/USD hit 1.2949 on Friday, the session high; the pair subsequently consolidated at 1.2832, 0.84% lower for the week.
The pair is likely to find support at 1.2753, the low of September 11 and resistance at 1.2949, Friday’s high.
The U.S. Department of Labor said the economy added 171,000 jobs in October, beating forecasts for an increase of 125,000. The unemployment rate ticked up to 7.9% from 7.8% in September as more people re-entered the labor force.
The stronger-than-expected data saw investor’s trim back expectations for another round of quantitative easing by the Federal Reserve, bolstering demand for the greenback.
The dollar also found support amid uncertainty over the outcome of Tuesday’s U.S. presidential elections, with opinion polls indicating a dead heat between President Barack Obama and Republican challenger Mitt Romney.
Investors are concerned over the U.S. fiscal cliff, approximately USD600 billion in tax hikes and spending cuts due to come into effect on January 1, which could threaten U.S. and global growth.
Sentiment on the single currency was hit by ongoing uncertainty over when Spain may request a bailout and whether Greece can implement austerity measures in order to secure the next tranche of its bailout funding.
Earlier Friday, a report showed that the final euro zone manufacturing purchasing managers’ index for October came in at 45.4, contracting for the 15th successive month as output and new orders fell.
In the coming week, investors will be anticipating the outcome of Tuesday’s U.S. presidential elections and looking ahead to policy meetings by the Bank of England and the European Central Bank on Thursday.
In addition, market participants will be awaiting any further developments in the handling of the debt crisis in the euro zone.
Ahead of the coming week, Forexpros has compiled a list of these and other significant events likely to affect the markets.
Monday, November 4
The euro zone is to produce a report on investor confidence, an important indicator of economic health. Elsewhere, Spain is to publish official data on employment change, a leading indicator of economic health, as well as data on service sector activity.
In the U.S., the Institute of Supply Management is to publish data on service sector activity.
Tuesday, November 6
In the euro zone, Germany is to produce official data on factory orders, a leading indicator of production.
In the U.S, voting in the U.S. presidential elections is to take place.
Wednesday, November 7
-->
The euro zone is to produce official data on retail sales, the leading indicator of consumer spending, which accounts for the majority of overall economic activity, while Germany is to produce official data on industrial production, a leading indicator of economic health.
The U.S. is to publish government data on crude oil stockpiles.
Thursday, November 8
In the euro zone, the eurogroup of finance ministers are to hold talks in Brussels to discuss financial issues in the bloc. In addition, the ECB is to announce its benchmark interest rate. The announcement is to be followed by a press conference with ECB President Mario Draghi to discuss the monetary policy decision.
Also Thursday, the U.S. is to publish official data on the trade balance as well as the weekly government report on initial jobless claims.
Friday, November 9
In the euro zone, France and Italy are to release official data on industrial production.
The U.S. is to round up the week with preliminary data from the University of Michigan on consumer sentiment, a leading indicator of economic health.
Inscription à :
Commentaires (Atom)


