The Canadian dollar continued its retreat against the US dollar on the background of weak Canadian retail sales and Ben Bernanke mention of a possibility of tapering QE.
USD/CAD is now at the highest levels since June 2012, leaving two previous peaks behind. The next significant resistance is far.
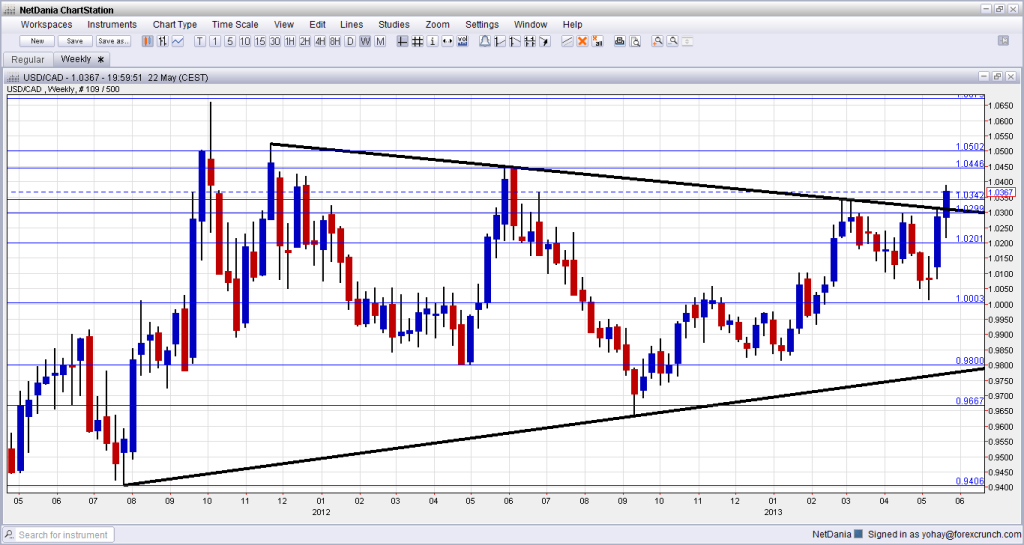
Here is the weekly chart, showing the big break of USD/CAD:
Domestic data began the slide: The volume of retail sales in Canada remained flat, contrary to expectations of a rise of 0.2%. The rise in the previous month was revised to the downside: from 0.8% to 0.7%. Core retail sales dropped by 0.2%, worse than a rise of 0.2% that was predicted. This was only the first mover.
And then came the Bernanke roller coaster
At first, the prepared statement was released. Bernanke mentioned that a premature withdrawal of QE could hurt the recovery and repeated the general stance that QE could either be increased or reduced. This sent the dollar lower across the board.
But then, when asked about an exit strategy, the Chairman of Federal Reserve mentioned that it could be seen in the next few meetings, depending on the economy, unemployment, etc.
The very cautious words were enough to send the dollar rallying fast, and the Canadian dollar surrendered.
USD/CAD Levels
USD/CAD rose to the 1.0340 level at first. This was a stubborn peak seen in February 2013. After a short pause, the pair continued forward, breaking above the 1.3060 level that was a peak back in early June 2012.
After peaking at 1.0385, the Canadian dollar managed to make a small recovery.
Looking at the chart, we can clearly see that this move also broke above the downtrend resistance line that began in mid 2011, was formed in May-June 2012 and was touched again in February. The three touches make it an important line, and the break is strong and clear.
The next lines above are 1.0446, which was the peak in May-June 2012. It’s quite far at the moment. It is followed by 1.0523, which capped the pair in November 2011.

Aucun commentaire:
Enregistrer un commentaire